
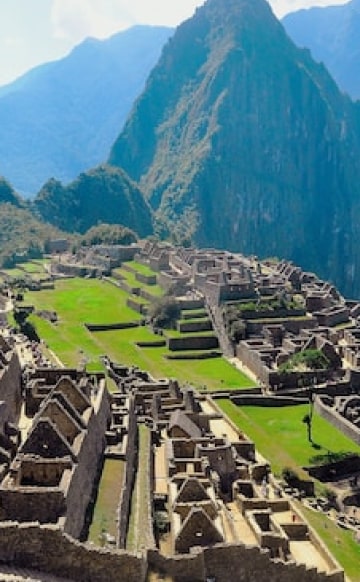


Why Staycation Popularity in Indiana is Soaring Above the National Average

Hometown pride is swelling in Indiana. Interest in staycationing within the state is at an all-time high, and Hoosiers are searching for things to do near them more than ever. Staycations became popular in the U.S. during the pandemic, but no state embraced that concept more than The Crossroads of America. Interest in local tourism is rising in more of Indiana’s metropolitan areas than anywhere else in the nation.
Our Most Interesting Findings
-
- Local tourism recovery in Indiana exceeds the national average by 25 percentage points.
- Indiana has the largest city in the nation, with rising searches for local tourism in 2021.
- Although Hoosiers are more interested in exploring their state than ever, inbound travel to Indiana is still down 16% from before the pandemic.
Local Tourism Definition: More commonly known as a ‘staycation,’ local tourism is a trip or vacation to visit the attractions and scenes where the tourist resides. Beyond a routine weekend out and about town, local tourism means getting to know areas not typically frequented by the tourist in their locale and staying somewhere outside the tourist’s residence but close to home.
We obtained travel-related search data for the 210 U.S. metropolitan areas tracked by Google Trends, which analyzes the popularity of top Google search queries. An analysis of local tourism searches reveals local interest in Indiana staycations is growing in more of the state’s metros than anywhere in the nation. However, out-of-state interest in visiting The Hoosier State is down in every metro.
What’s Happening
Tourism is not one of Indiana’s economic engines; it’s only its 12th-largest employer. The state suffered fewer tourism-related financial and employment losses during the pandemic than travel-dependent areas. Even more, the state faired better when examining proportionate losses. In New York City, visitor spending fell by 75% in 2020. Meanwhile, spending fell less than a percent in travel-dependent Hoosier counties, Floyd and Clark. Much of Indiana’s sustained interest in tourism during the pandemic came from locals, which is true of much of the Midwest.
Holding 12 of the nation’s 31 recovered metropolitan areas, the Midwest leads local tourism recovery. Three of those are in Indiana, and only one other state in the Midwest had more than one, Michigan. As with most of the nation, tourism in Indiana is recovering faster in its rural areas. The state capital, Indianapolis, outperformed every U.S. city for group occupancy in 2021 and had more live events than anywhere in the nation. However, Indy’s domestic and international travel searches are down nearly a quarter from 2019, and local tourism searches are still down a little over a third.
Recent residential sentiment survey results from Longwoods International on behalf of SoIN Tourism reveal 78% of respondents want more tourism opportunities in their area, 18 points ahead of the national average. And three-quarters said tourism is beneficial to their region — outpacing the Midwest and the U.S. by 14 and 16 percentage points. These results surprised SoIN Tourism Executive Director Jim Epperson so much that he questioned them. After determining the methodology to be valid, Epperson realized the results reflected state destination marketing organizations’ work, targeting residents with tourism messages during the pandemic instead of their regular audience — out-of-state visitors.
Local Impact
The small city of Terre Haute witnessed a 43% increase in local tourism searches in the last half of 2021 over 2019. Its population size mirrors most U.S. areas that saw rising staycation searches during the pandemic. Terre Haute is known locally for its excellent wildlife viewing opportunities. Still, a new casino is coming to the area, and some of those increased searches could be traveler speculation for future vacations rather than immediate intent to visit. Nevertheless, community members are aware of the shift in attitudes and are working proactively to expand opportunities in the city for both locals and tourists.
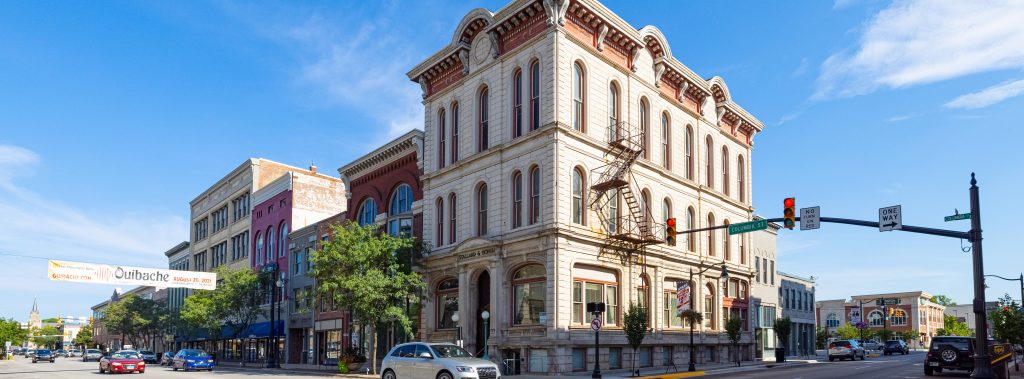
One notable outlier is Fort Wayne, Indiana. The city is the largest in the nation to see rising local tourism searches in 2021 — up 47%. The city ranks No. 8 out of 210 metros for local tourism growth, and no other city in the country close to its size grew in local tourism in 2021. Springfield, Illinois, is the next largest city with rising staycation interest. It’s two-thirds the size of Fort Wayne, and searches only grew by 5%.
Evansville is the latest metro to recover in Indiana. While local tourism searches are only 2% ahead of 2019, the city is the seventh-largest in the nation to recover in 2021. Already a tourist destination, “River City” has the state’s first casino, a vibrant sports tourism industry, and serves as a culture-entertainment hub for the tri-state area. During the pandemic, local tourism in the nation rose more in regions that are not typically tourist destinations. Evansville sets itself apart because it managed to retain local tourism interest despite its larger size and existing tourism dependency.
This analysis is part of a more extensive nationwide study of recovering local, domestic and international interest in tourism as measured by travel-related Google searches in 210 U.S. cities. Read the full report here:
US Tourism Interest is Slowly Recovering, but Several Cities Surge Over 250%
Methodology
We created this article’s visualizations and analysis from a list of the 210 U.S. designated market areas tracked by Google Trends to compare travel interest, July-Dec 2019 to 2021. We broke our study into two sections, (1) Measure local tourism (staycation) interest in these areas and (2) Measure U.S. domestic and international travel interest in visiting these cities.
We used the popular search phrase “things to do” to gauge interest for both sections. The search keyword “things to do near me” allowed us to gain a peripheral view of local tourism interest within each metro using the interest by region feature of Google Trends. Then, we analyzed global searches for keywords, “things to do in [city]” to gauge domestic and international interest in visiting the 210 metros using the interest over time feature.
We used a control word to gather data for the 210 domestic and international queries. The control word is more popular than any single keyword search but not so popular that locations with less popularity normalize to zero. Our control word was “learn to fly.” Naturally, it varied in favor between 2019 and 2021, so we scaled the averages of 2019 to 2021 to perform a direct comparison.
Our local tourism analysis is based on the 210 U.S. designated market areas (DMAs), also known as media markets, that define TV and radio territory in the country. The 210 DMAs cover the entire U.S. To avoid longtail metro keywords in our domestic and international analysis, we used the most populous city in each DMA for each “things to do in [city]” query.
Google Trends calculates popularity by region and interest over time using a scale of 0 to 100. A score of 100 is the area or time a keyword was most popular as a proportion of total searches in that area or timeline. A recovering city has a higher proportion of searches for our keyword in 2021 over 2019, not a higher absolute query count. Google Trends bases its data on a random sample of searches representative of all Google searches. It does not use every search made during a specified query timeframe — providing the whole data set would be too large to process. Therefore, it is possible to obtain varying results for the same query. To combat this, we ran all of our searches twice on different days and averaged the results to attain higher accuracy. We exported all data for this project between 2/10/22-2/11/22.
We obtained city population estimates from the U.S. Census Bureau.
You can download our Google Trends analysis (from Google Drive) here.
Excel, Flourish, Tableau and Google Trends were the tools used to analyze and create data visualizations for this article.
